
VIBe Check 2026
Advocacy · CEO Message · EBA
VIBe Check 2026: What Bellevue Voters Are Saying
Joe Fain | June 2026
Every year, the Bellevue Chamber of Commerce asks a simple question: what are Bellevue voters actually thinking? Answering it well takes a rigorous instrument, a consistent method held steady over time, and the patience to listen even when the answers are complicated. That is what the VIBe Check (Voter Insights Bellevue) is built to do, and 2026 marks its sixth consecutive year.
This is not a quick online poll. Each wave is a representative survey of roughly 400 likely Bellevue voters, conducted by the professional polling firm Fulcrum Strategy Group, with a margin of error of about ±4.8%. Because the questions are asked the same way every year, the VIBe Check shows not just where opinion sits today, but how it has moved. This year we also set Bellevue’s results alongside the Seattle Metropolitan Chamber’s “Index,” now in its 10th year, to see how attitudes compare with the region’s largest city.
By the Numbers
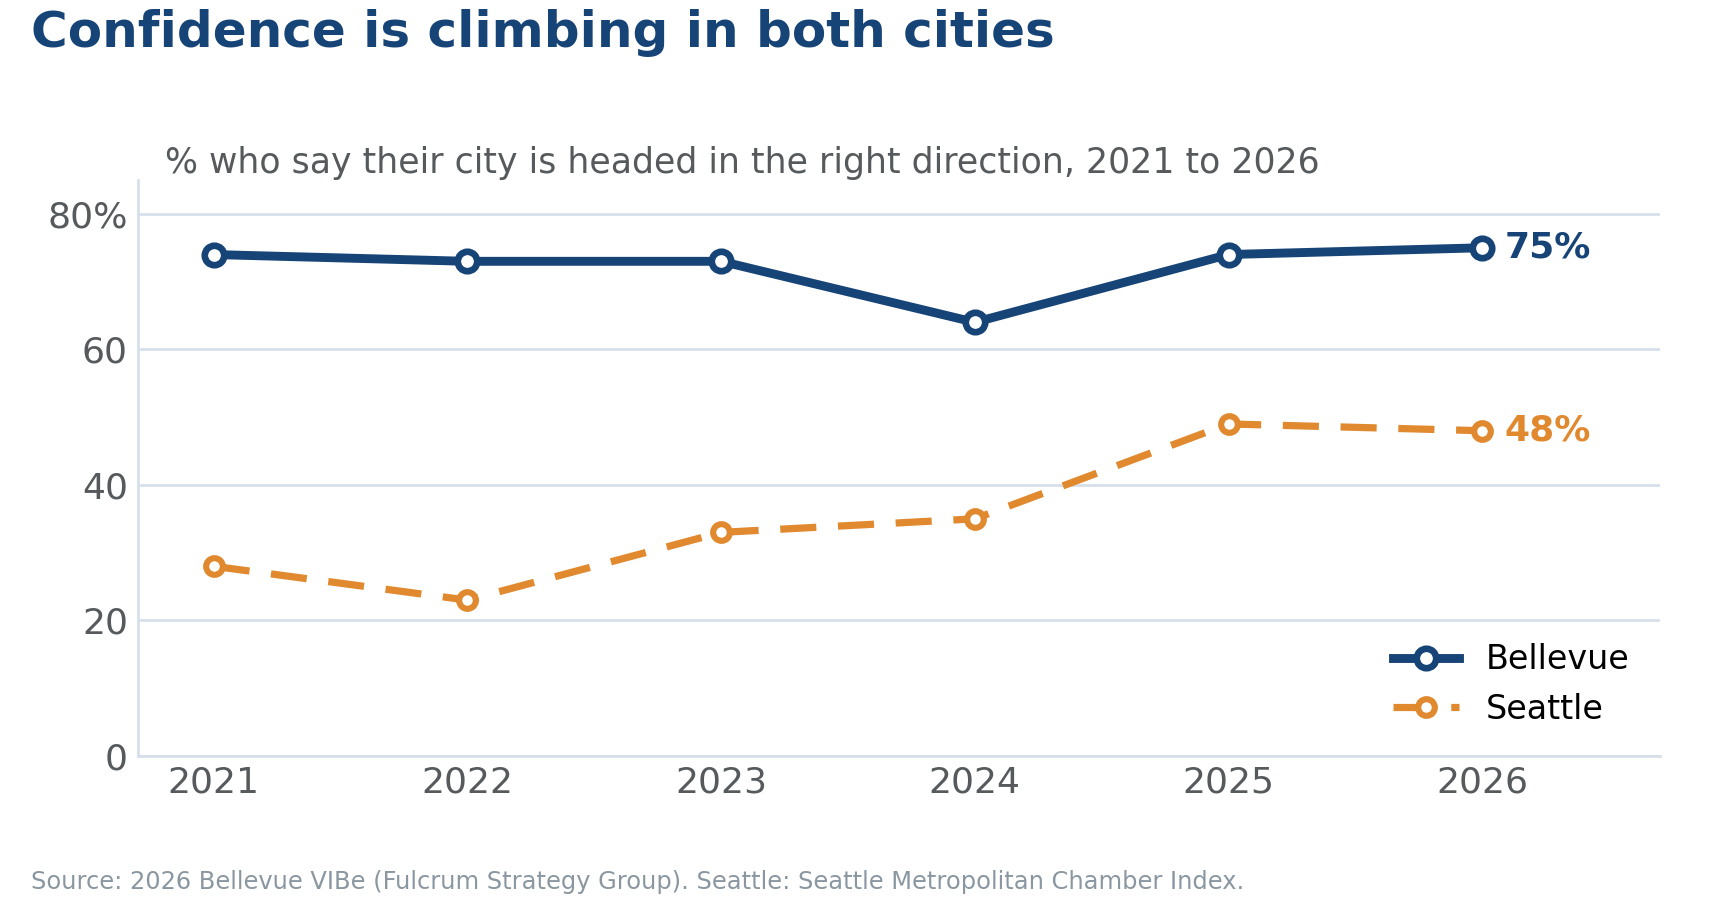
75%
say Bellevue is headed in the right direction
96%
feel safe downtown during the day
86%
favorable view of the Police Department
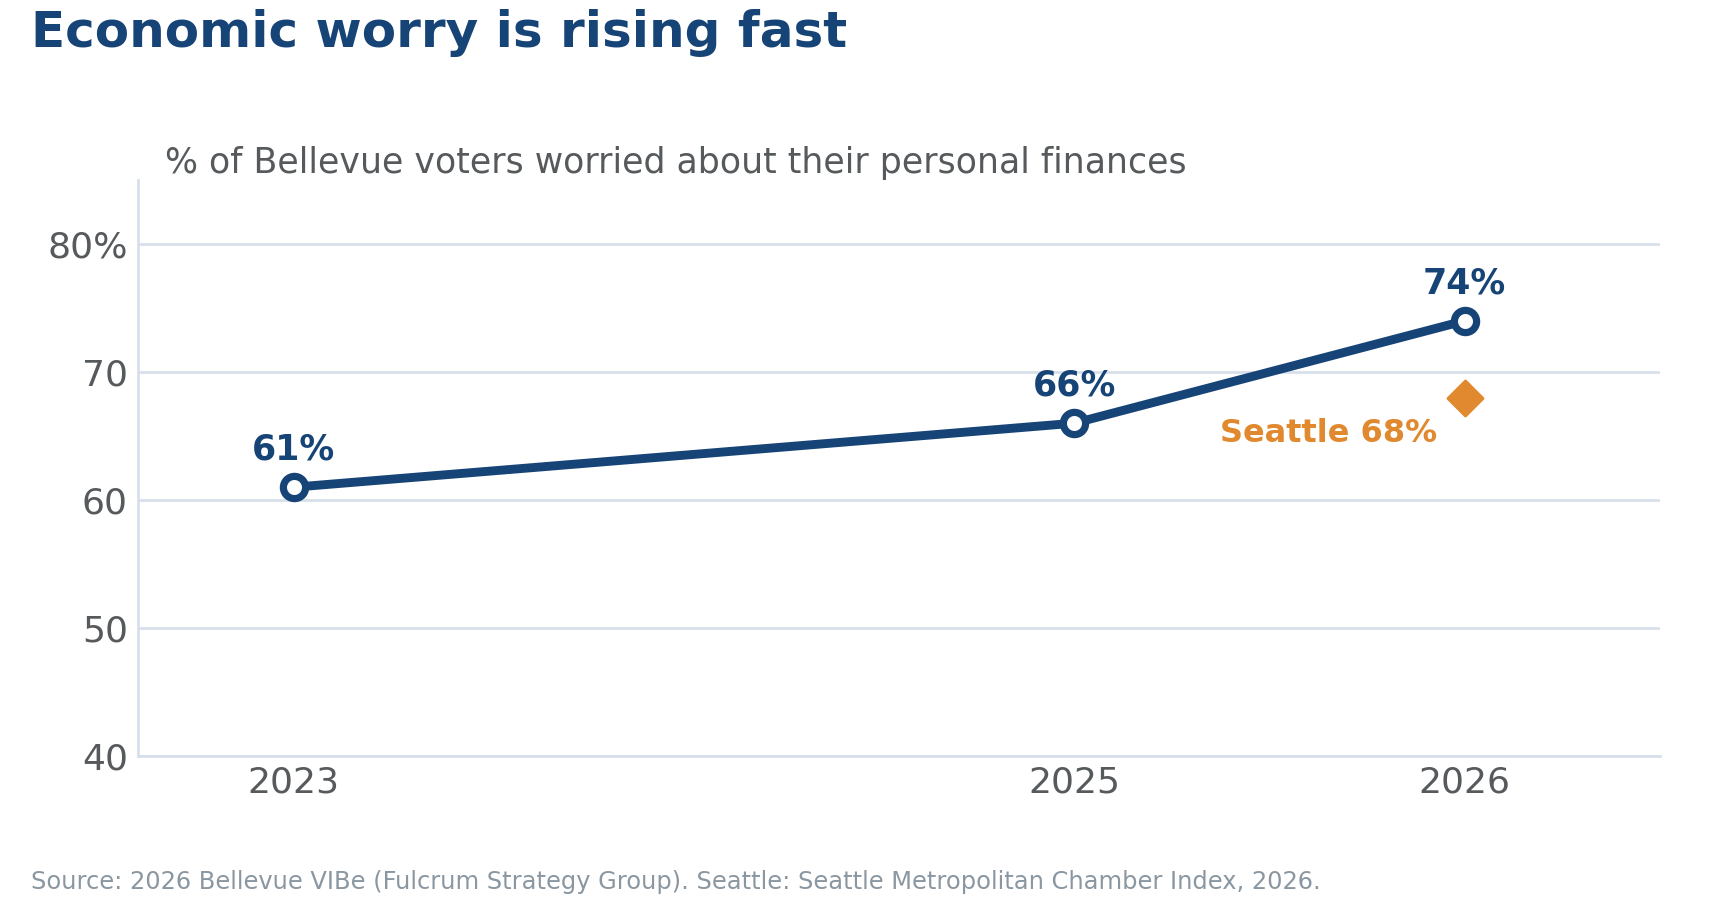
74%
worried about their personal finances
A confident Bellevue, and a Seattle on the rise
Bellevue feels good about itself. Seventy-five percent of voters say the city is headed in the right direction, and optimism about the future has rebounded to its highest level in five years. Seattle deserves credit, too. The share of Seattle voters who say their city is on the right track has climbed from 28% in 2021 to 48% in 2026, and its optimism has grown steadily from a 2022 low. Both cities are hopeful in their own ways, and the region is stronger when both thrive.
Two electorates, two civic personalities
Some of the most interesting findings aren’t about opinions at all. They are about who is doing the answering. Bellevue and Seattle are both highly educated (over 70% hold a four-year degree) and similarly diverse, but they draw on very different communities of voters, and that composition shapes their politics. Bellevue’s electorate is older and more settled: about 58% are 50 or older, and three in four own their homes. Politically it is balanced, roughly 47% Democratic, 22% Republican, and 31% independent. Seattle’s voters skew younger and are far more likely to rent, and they lean strongly progressive, with close to three-quarters identifying as Democratic or socialist, compared with 47% in Bellevue, which has nearly twice the Republican share.
Much of the gap between the two cities is not disagreement so much as a reflection of who lives there.
Public safety: Bellevue’s strongest brand
If one area shows Bellevue’s confidence, it is safety. Ninety-six percent of voters feel safe visiting downtown during the day, and the city feels secure after dark as well. The Bellevue Police Department is the most trusted institution we test, with an 86% favorable rating that has held in the mid-to-high 80s for years. The share of residents who feel safe in their own neighborhood has risen every year, from 87% to 93%. That is a strong foundation, and a credit to the community and the people who serve it.
What Bellevue loves, and what it doesn’t
Some of the clearest signals come from how Bellevue voters want to get around. Bellevue loves walkability. Voters want sidewalks and pedestrian infrastructure, one of the few investments that draws strong net support year after year. The same enthusiasm shows up for the Grand Connection, the planned pedestrian and bike crossing over I-405, which 67% of voters support, one of the most popular big ideas we tested.
The flip side is just as clear. Voters dislike bike lanes that come at the expense of road lanes. Converting car lanes into bike lanes is the single most unpopular transportation idea in the survey. Appetite for adding new general road lanes has faded to near zero, with one exception: fixing congested intersections, among the most popular uses of transportation funding.
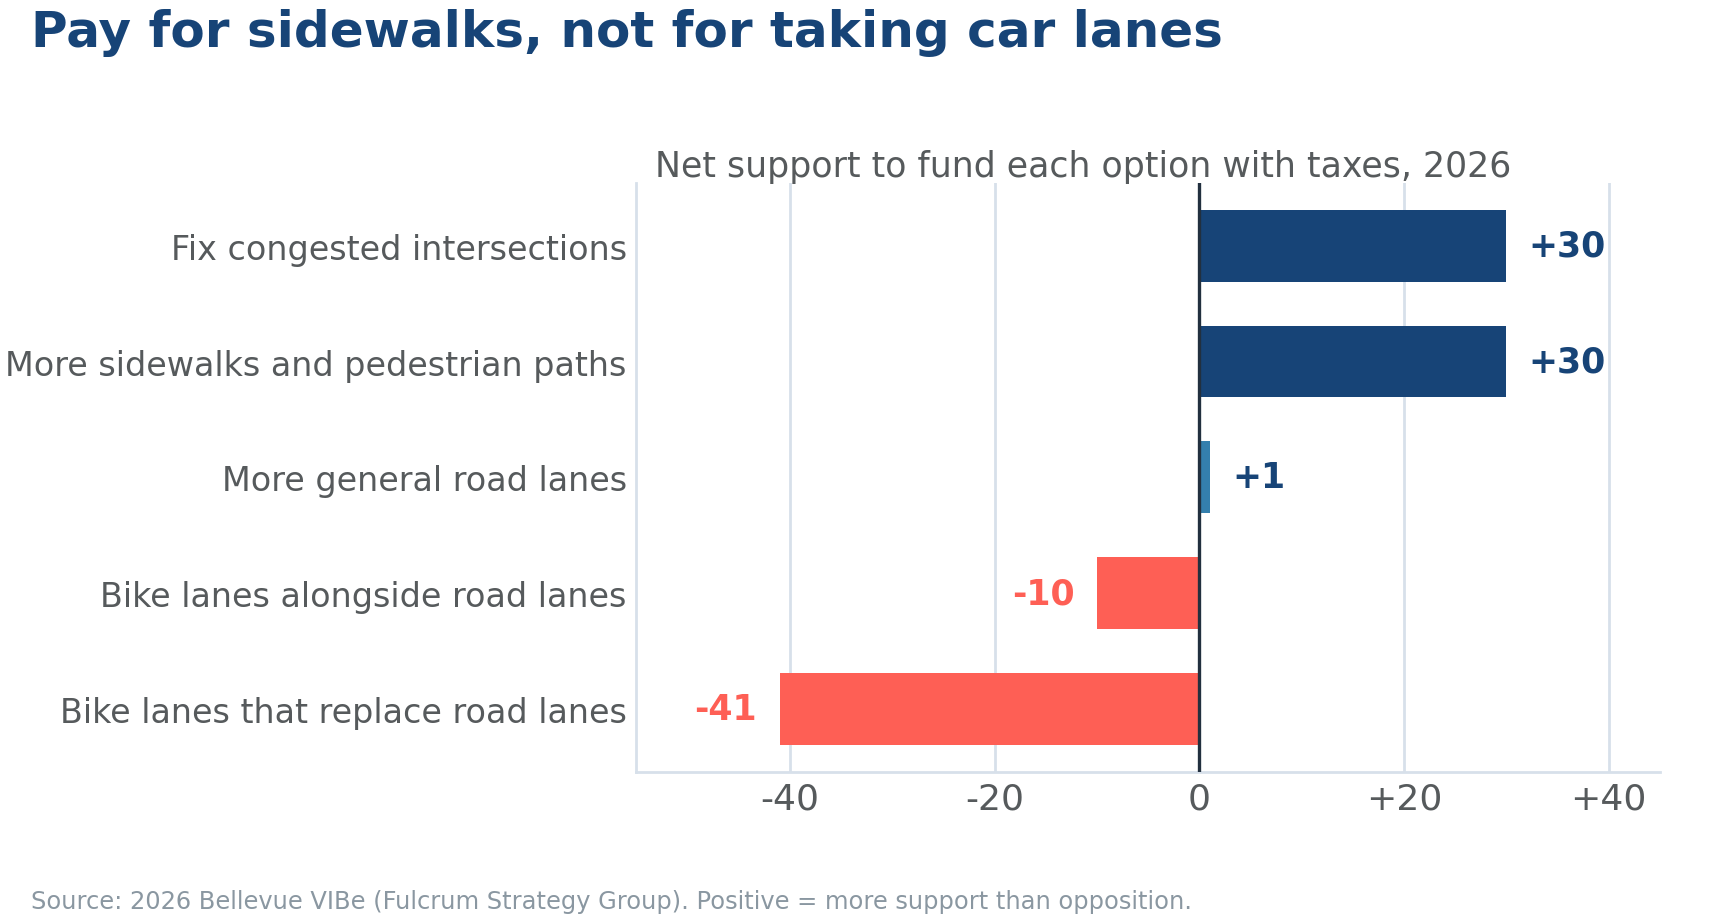
Bellevue voters will pay for sidewalks and crossings. They will not pay to turn car lanes into bike lanes.
A rising tide of economic insecurity and tax fatigue
Beneath the optimism runs a more cautious current, and it is the most important trend in this year’s data. The share of voters worried about their personal finances has climbed sharply, from 61% in 2023 to 74% in 2026, now higher than Seattle’s 68%. For an affluent city, that signals real household pressure.
That anxiety is reshaping views on taxes and spending. The share of Bellevue voters who say taxes are too high for the services they receive jumped to 60% in 2026, up from around 50%, converging toward Seattle’s long-running levels. Trust that the City will spend tax dollars responsibly has slipped from 71% in 2021 to 53% today. Appetite for new taxes is shrinking across the board: support for raising taxes to fund low-income housing has fallen from 47% to 28% over six years.
Optimism is at a five-year high, yet trust in how the City spends has fallen to 53%.
A closer look
The next phase of the VIBe Check is to dig into the crosstabs, the underlying data that breaks the results down by subgroup to reveal the most interesting threads to pull on. We invite you to follow along as we share more of this valuable research publicly, making it easier for all of us to listen to and learn from what our community has to say.
Browse all six years of results in the interactive dashboard at bellevuechamber.org/vibe-check.
The 2026 VIBe Check (Voter Insights Bellevue) was conducted by Fulcrum Strategy Group for the Bellevue Chamber of Commerce, surveying approximately 400 likely Bellevue voters in June 2026 (margin of error ±4.8%). Seattle comparisons are drawn from the Seattle Metropolitan Chamber’s “Index” survey, Spring 2026.
Categories
Bellevue Chamber President & CEO Joe Fain: “In practical terms, this means taxpayers and employers from every corner of Washington would be directly subsidizing the City of Seattle’s budget.”
Read the editorial: https://lnkd.in/g-MttGZa
As we evaluate the legislation, we’re focused on affordability impacts for families and employers, whether outcomes are tangible in communities, and how the policy affects long-term budget sustainability and Washington’s competitiveness.
Chamber President & CEO Joe Fain also flagged several structural issues that need closer review, including treatment of pass-through entities, charitable deductions, a potential marriage penalty, and interactions with other state tax policies.
Read more: https://lnkd.in/g8Uv_wD4